CO2 Monitoring GUI for Robotic Fish Experiments
A custom Python-based GUI developed for real-time CO2 monitoring, robotic fish control, live camera tracking, and 3D trajectory visualization during underwater experiments.
CO2 Monitoring GUI for Robotic Fish Experiments
This project was a custom graphical user interface developed for real-time CO2 monitoring during robotic fish experiments. The GUI was designed to support underwater testing in a laboratory water tank, where the robotic fish could be controlled manually or through mission mode while live CO2 concentration data was collected, displayed, and saved.
The purpose of this project was to bring several experimental functions into one dashboard: robot control, CO2 data streaming, camera monitoring, fish tracking, battery/status display, data logging, and 3D visualization. Instead of using separate tools for control, sensing, and plotting, this GUI provided one integrated interface for running and observing the experiment.
Project Motivation
Underwater robots are useful for inspection, environmental monitoring, and infrastructure sensing. For my robotic fish experiments, I wanted the system to not only move inside the water tank but also collect CO2 concentration data and associate that data with the robot's position.
A normal sensor reading alone is useful, but it becomes more meaningful when it is connected with the robot's location and motion. This GUI was developed to make that connection visible during experiments. It allowed me to monitor the fish, observe live CO2 values, and visualize the data in real time.
Main Features
The GUI includes several control and monitoring features:
- Real-time CO2 concentration display in ppm
- Live response log from the sensing module
- Manual control of actuator position, tail speed, and tail angle
- Start and stop mission buttons
- IP-based communication with the robotic fish
- Battery voltage and percentage display
- Live camera feed from the water tank
- Fish selection and tracking box
- CO2 overlay on the camera feed
- 3D plot for trajectory and CO2 data visualization
- Options to clear plotted data and save CO2 data
Robot Control Interface
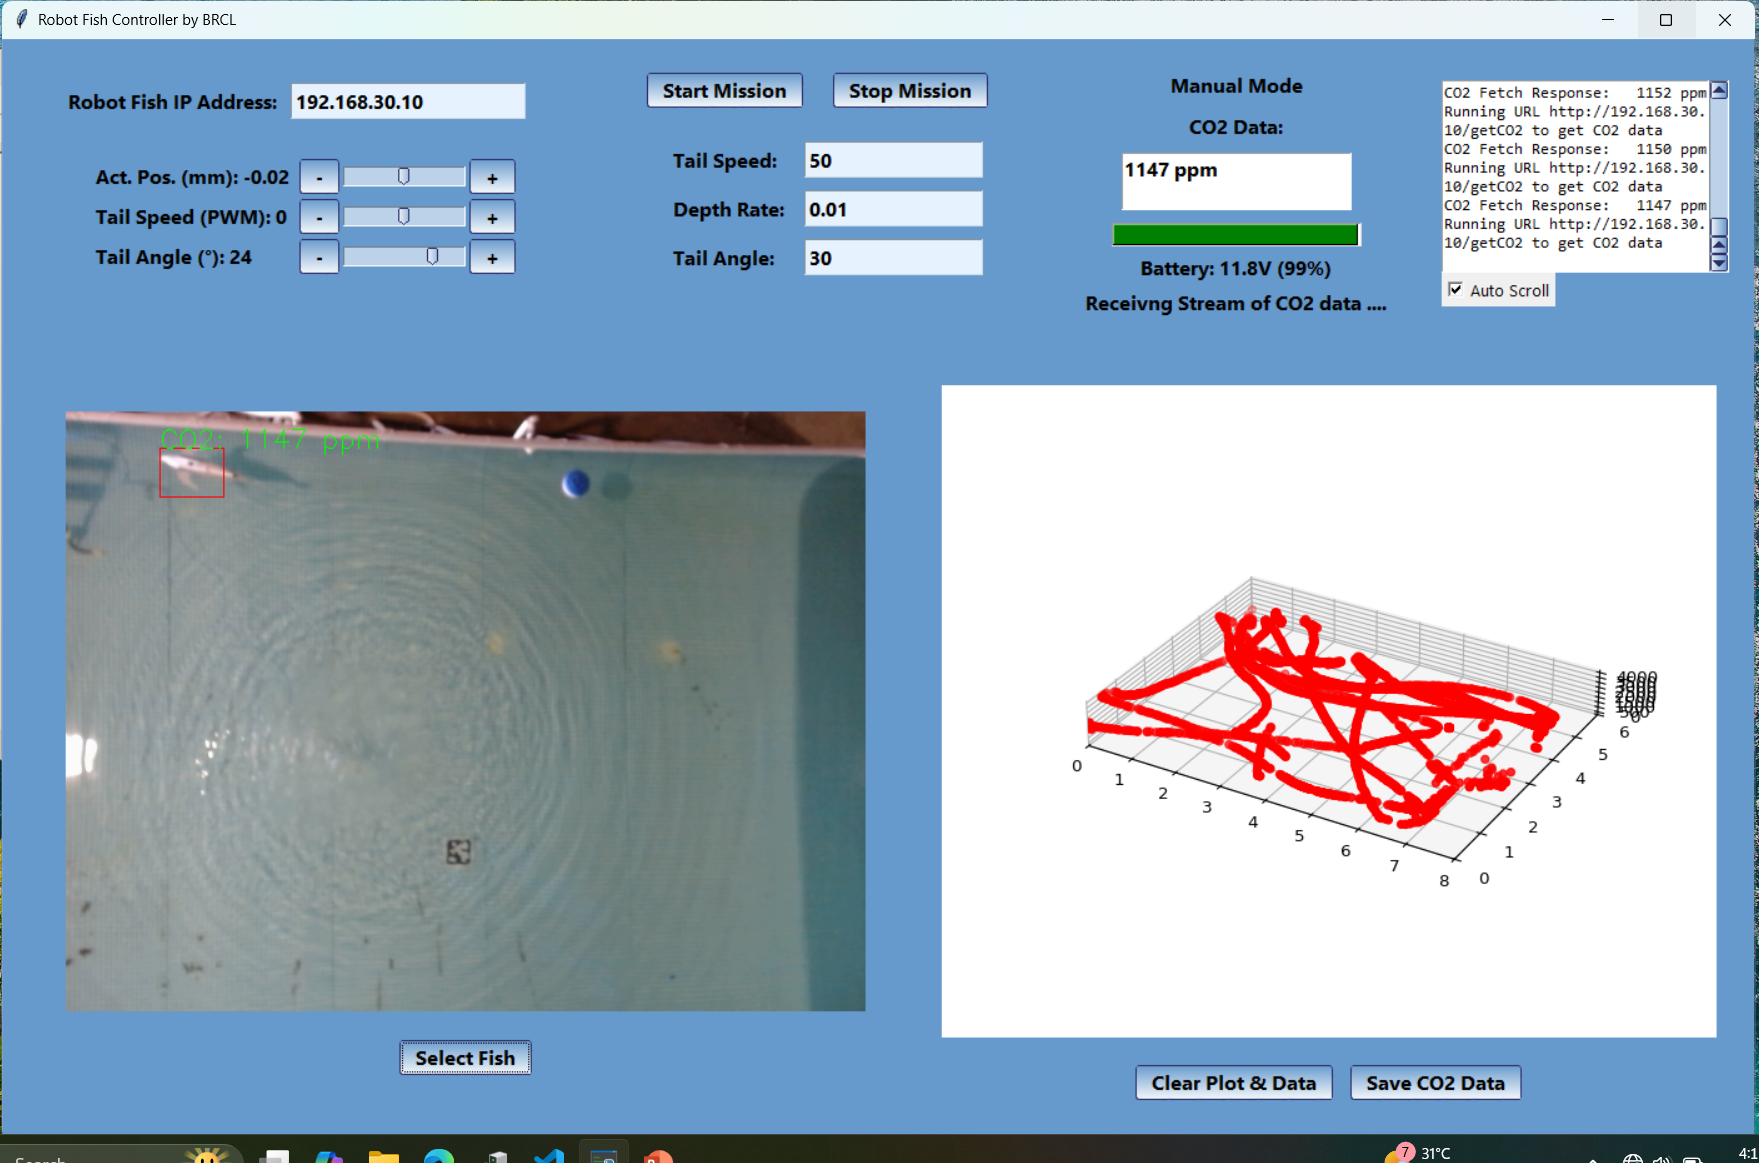
The left side of the GUI provides manual control for the robotic fish. The operator can adjust actuator position, tail speed, and tail angle using sliders and increment/decrement buttons. This was useful during testing because the fish could be controlled directly without changing the code.
The GUI also includes Start Mission and Stop Mission buttons. These buttons allow the system to switch from manual operation to mission-based testing. This made the interface useful both for debugging and for running repeatable experiments.
Real-Time CO2 Monitoring
The CO2 monitoring section continuously fetches sensor data from the robot or sensing system and displays the latest value in ppm. In the shown test, the GUI displays readings around 1147 ppm.
The response log on the right side shows the data-fetching process, including the robot IP address and repeated CO2 responses. This log was important for debugging because it confirmed whether the GUI was successfully receiving live data.
Camera-Based Fish Tracking
The GUI includes a live camera feed from the water tank. The user can select the fish or a region of interest, and the GUI displays a tracking box on the video frame. The live CO2 value is also overlaid on the camera view.
This helped connect the sensor reading with the robot's physical position in the tank. During experiments, I could confirm the camera feed, the tracked region, and the CO2 stream at the same time.
3D CO2 Trajectory Visualization
The right side of the interface includes a 3D plot that visualizes the robot's movement and CO2 data. This plot was developed to make the experiment easier to interpret. Instead of looking only at numerical CO2 values, the operator can see how the measured data changes along the robot's path.
The GUI also includes buttons to clear the plot and save CO2 data, which made it easier to run multiple experiments and store results for later analysis.
Communication and Integration
The GUI communicates with the robotic fish through an IP address. In the screenshot, the robot fish IP address is:
192.168.30.10
The GUI sends requests to the robot or sensing module, receives CO2 data, updates the display, and plots the results. This made the software a central layer connecting the robot hardware, CO2 sensor, camera feed, and experimental data visualization.
My Contribution
My contribution was focused on developing and integrating the GUI for robotic fish CO2 monitoring experiments. This included the control layout, live CO2 display, IP-based data fetching, camera feed integration, tracking overlay, 3D plotting, and data-saving functions.
The project combined software development with experimental robotics needs. The GUI had to be practical for real lab testing, not just a visual demonstration.
Skills Used
- Python GUI development
- Tkinter interface design
- Real-time data streaming
- HTTP/IP-based communication
- Camera feed integration
- Computer vision overlay
- Robotic fish control interface design
- CO2 sensor data visualization
- 3D plotting
- Experimental data logging
- Underwater robotics testing support
Outcome
The final GUI provided a working dashboard for robotic fish CO2 monitoring experiments. It allowed the operator to control the robot, receive live CO2 readings, monitor the camera feed, track the fish, visualize the data in 3D, and save experimental results.